Unbound Prometheus Exporter with Grafana Dashboard
A lightweight, bash-based Prometheus exporter for Unbound DNS resolver statistics. This exporter uses only bash and socat to provide comprehensive DNS metrics for monitoring with Prometheus and Grafana.
Features
- Pure Bash Implementation: No external dependencies except
socatandunbound-control - Comprehensive Metrics: Exports all available Unbound statistics including:
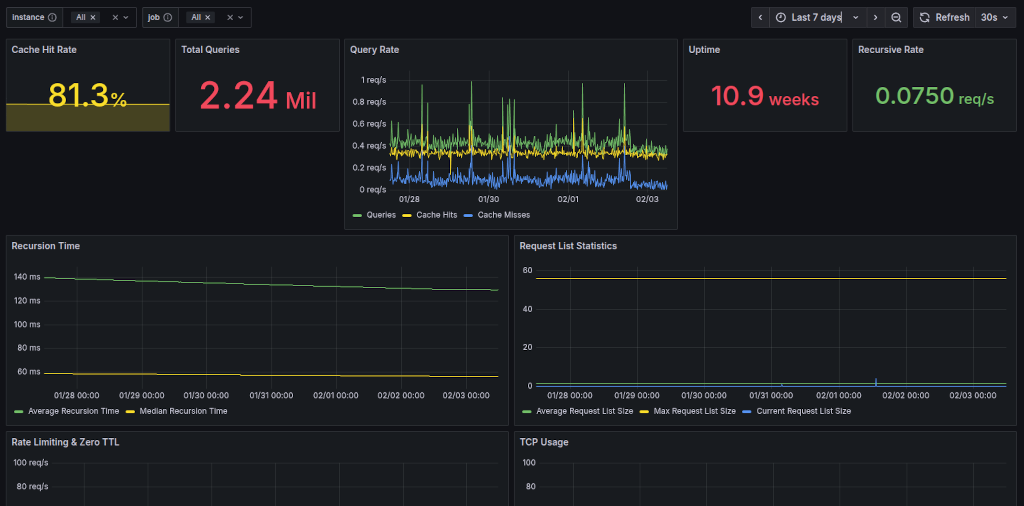
- Query rates, cache performance, and prefetching
- Rate limiting and security metrics (IP rate limiting, zero TTL)
- Performance metrics (recursion times, TCP usage)
- Detailed per-thread statistics with full breakdown
- Memory usage by component
- Request list and queue management statistics
- Extended query types and response codes (if configured)
- HTTP Server: Built-in HTTP server using socat for serving metrics
- Systemd Integration: Ready-to-use systemd service file
- Grafana Dashboard: Pre-built comprehensive dashboard