Apache2 Prometheus Exporter with Grafana Dashboard
A lightweight, bash-based Prometheus exporter for Apache HTTP server statistics via server-status. This exporter uses only bash, curl, and socat to provide comprehensive Apache metrics for monitoring with Prometheus and Grafana.
Features
- Pure Bash Implementation: No external dependencies except
socatandcurl - Comprehensive Metrics: Exports all available Apache server-status statistics including:
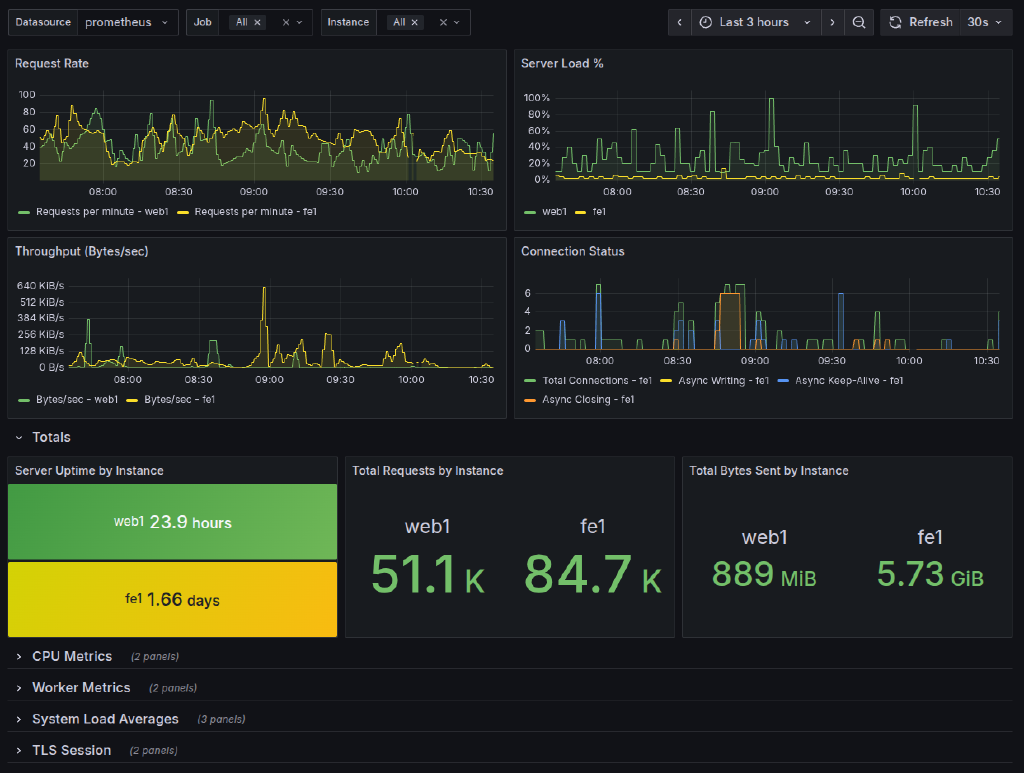
- Request rates, throughput, and total accesses
- Worker status (busy, idle) and detailed worker states (11 different states)
- Connection statistics (total, async writing, keep-alive, closing)
- CPU metrics (load, user/system time, children processes)
- System load averages (1m, 5m, 15m)
- TLS session cache statistics (usage, operations, hits/misses)
- Request duration and performance metrics
- Server version and uptime information
- Per-instance monitoring with labels
- Calculated metrics like load percentage
- HTTP Server: Built-in HTTP server using socat for serving metrics
- Systemd Integration: Ready-to-use systemd service file
- Grafana Dashboard: Pre-built comprehensive dashboard
- Multi-Instance Support: Monitor multiple Apache servers from single exporter