Postfix Prometheus Exporter with Grafana Dashboard
A lightweight, bash-based Prometheus exporter for Postfix mail server statistics. This exporter uses only bash and socat to provide comprehensive Postfix metrics for monitoring with Prometheus and Grafana.
Features
- Pure Bash Implementation: No external dependencies except
socat - Comprehensive Metrics: Exports Postfix statistics including:
- Queue sizes (active, deferred, incoming, hold, maildrop, corrupt)
- Message counters (received, delivered, forwarded, deferred, bounced, rejected)
- SMTP connection statistics and SASL authentication
- Rejection reasons (RBL, HELO, sender, recipient, client, unknown user)
- Delivery status by transport (smtp, lmtp, virtual, pipe)
- Stateful Counter Tracking: Maintains persistent counters for accurate Prometheus rate calculations
- HTTP Server: Built-in HTTP server using socat for serving metrics
- Systemd Integration: Ready-to-use systemd service file
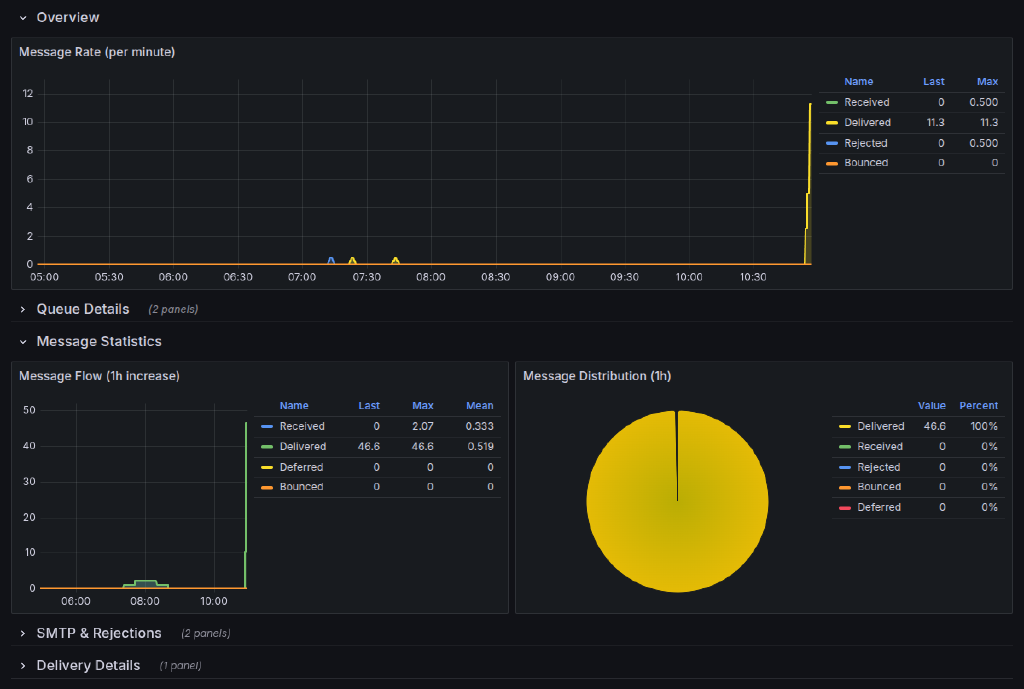
- Grafana Dashboard: Pre-built comprehensive dashboard
- Multi-Instance Support: Monitor multiple Postfix servers