Libvirt Prometheus Exporter with Grafana Dashboard
A lightweight, bash-based Prometheus exporter for libvirt hypervisor statistics. This exporter uses only bash, virsh, and socat to provide comprehensive virtualization metrics for monitoring with Prometheus and Grafana.
Features
- Pure Bash Implementation: No external dependencies except
socatandvirsh - Comprehensive Metrics: Exports all available libvirt statistics including:
- Hypervisor information (CPU, memory, version)
- Domain states, resource usage, and performance metrics
- Virtual CPU, memory, disk, and network statistics per domain
- Storage pool capacity, allocation, and availability
- Virtual network states and configuration
- Host NUMA memory information
- HTTP Server: Built-in HTTP server using socat for serving metrics
- Systemd Integration: Ready-to-use systemd service file
- Multi-Instance Support: Monitor multiple hypervisors
- Resource Filtering: Optional filtering of domains, pools, and networks
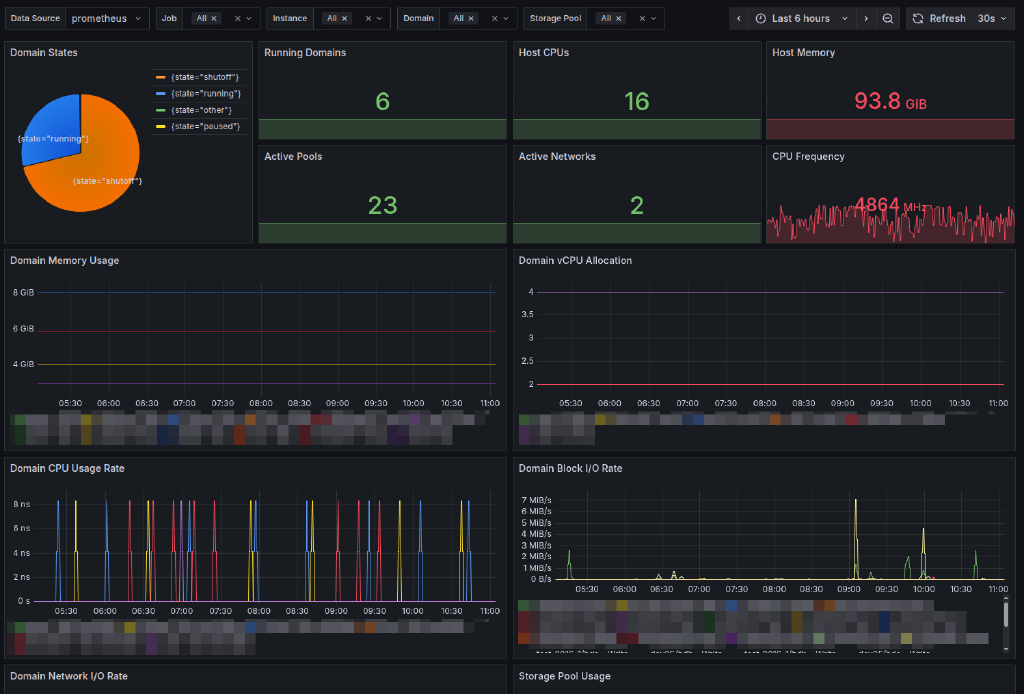
- Grafana Dashboard: Pre-built comprehensive dashboard