Dovecot Prometheus Exporter with Grafana Dashboard
A lightweight, bash-based Prometheus exporter for Dovecot mail server statistics. This exporter uses only bash and socat to provide comprehensive Dovecot metrics for monitoring with Prometheus and Grafana.
Features
- Pure Bash Implementation: No external dependencies except
socat - Comprehensive Metrics: Exports Dovecot statistics including:
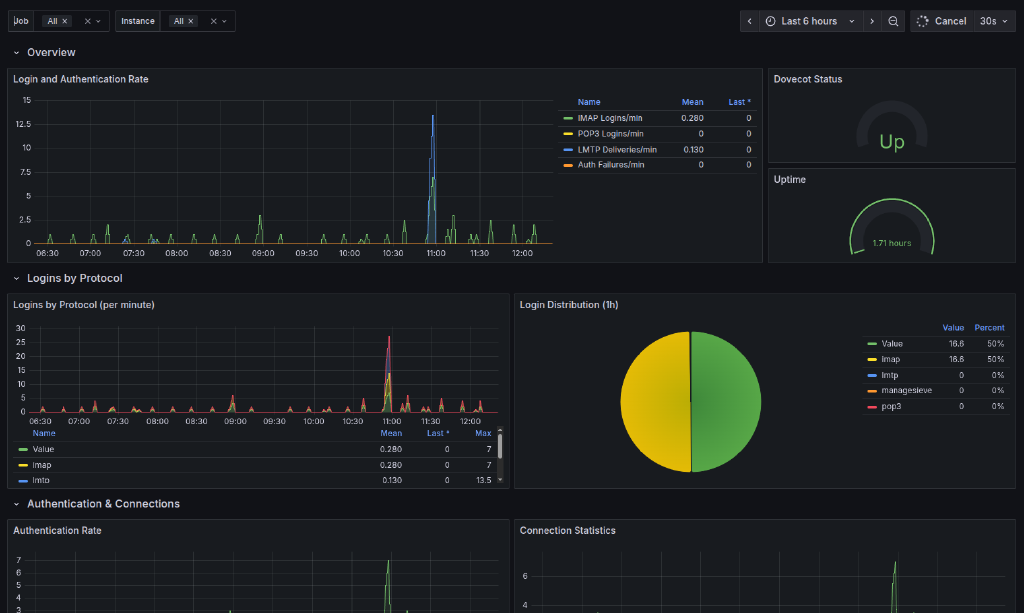
- Login statistics by protocol (IMAP, POP3, LMTP, ManageSieve)
- Authentication success and failures
- Connection and disconnection tracking
- Message operations (read, delete, expunge, save, copy)
- Mailbox operations (create, delete, rename)
- Bandwidth statistics (bytes read/written)
- Process status and uptime
- Dovecot version information
- Stateful Counter Tracking: Maintains persistent counters for accurate Prometheus rate calculations
- HTTP Server: Built-in HTTP server using socat for serving metrics
- Systemd Integration: Ready-to-use systemd service file
- Grafana Dashboard: Pre-built comprehensive dashboard
- Multi-Instance Support: Monitor multiple Dovecot servers